
Microsoft 365 Adoption Score-Describe Microsoft 365 apps and services
The Reports/Adoption Score page in Microsoft 365 admin center provides ratings and charts tracking how well the tenant organization utilized the Microsoft 365 technologies in the most recent 28 days, as shown in Figure 2-72.
The tool gathers information from various Microsoft 365 applications and services, including Exchange, SharePoint, Microsoft Teams, OneDrive, Word, Excel, PowerPoint, OneNote, and Outlook, to calculate the adoption score. The tool scores the organization in two areas:
- People experiences A score based on the degree of communication and collaboration among users, as well as the modes of communication they employ
- Technology experiences A score reflecting the performance and efficient use of the organization’s network hardware and software, based on Endpoint Analytics in Microsoft Intune and connectivity statistics for the Microsoft 365 services, including Exchange, SharePoint, and Microsoft Teams
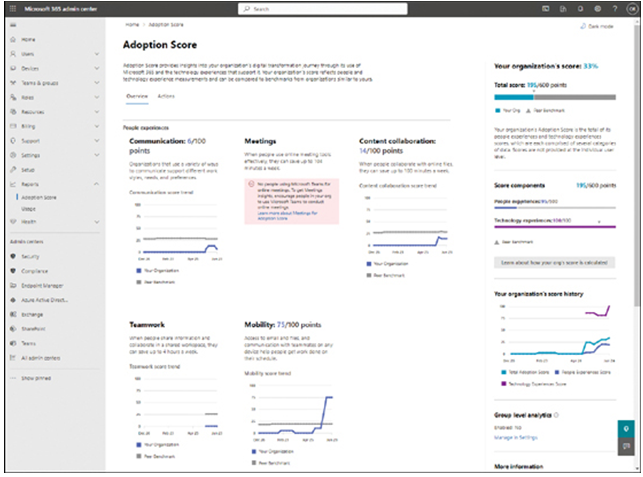
FIGURE 2-72 The Adoption Score page in the Microsoft 365 admin center
The Adoption Score tool evaluates the organization by assigning scores of up to 100 points in each of the following eight categories for a maximum possible score of 800:
- Communication (100 points)
- Meetings (100 points)
- Content collaboration (100 points)
- Teamwork (100 points)
- Mobility (100 points)
- Endpoint analytics (100 points)
- Network connectivity (100 points)
- Microsoft 365 Apps Health (100 points)
In addition to the score, the Adoption Score page also provides insights and recommendations for improving collaboration and productivity, as shown in Figure 2-73.
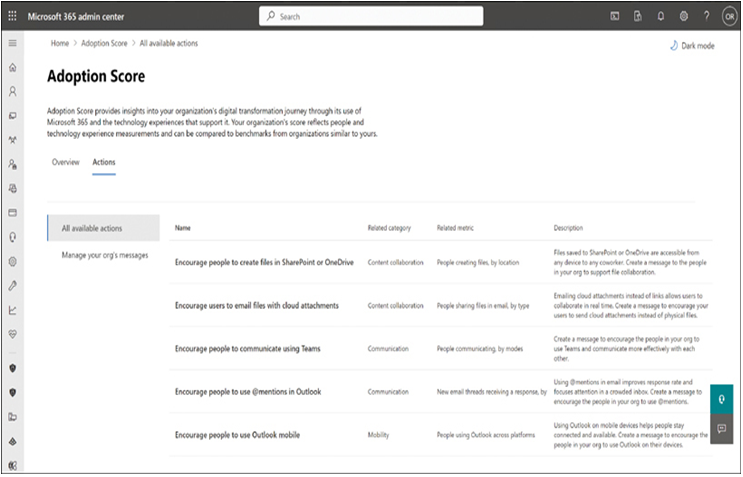
FIGURE 2-73 The Actions tab on the Adoption Score page in the Microsoft 365 admin center
Microsoft 365 usage
The Reports/Usage page in Microsoft 365 admin center can display information about activity levels in the various Microsoft 365 services in chart form, as shown in Figure 2-74. Administrators can modify the charts to display 7, 30, 90, or 180 days of information. Microsoft 365 Usage Analytics is a service within the Power BI business analytics tool to track how workers use the various Microsoft 365 components over the previous 12 months in much greater detail.
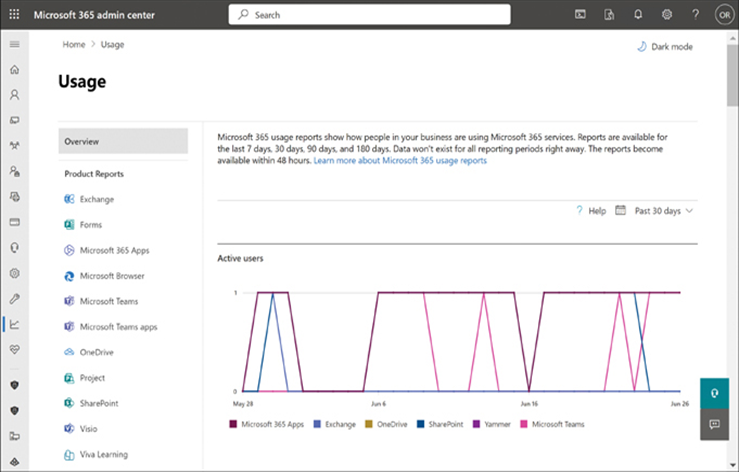
FIGURE 2-74 A service usage chart in Microsoft 365 admin center
Administrators can use the Power BI–based service to determine what tools workers use to perform specific types of tasks, which Microsoft 365 components are over- or underused, and which might be seldom adopted. This type of information can enable administrators to determine whether workers might need training to better use specific tools available to them.
For example, some users might complain that it is difficult for them to communicate company-wide because they usually spend most of their time with their immediate team members. These users might not be aware that Viva Engage exists or know how to use it. A brief tutorial might resolve these users’ problem and increase cross-communication within the enterprise.
With the information that Microsoft 365 gathers, the administrator can add the Microsoft 365 Usage Analytics connection to the Power BI application, authenticate the enterprise’s tenancy, and generate a dashboard of chart-based data, as shown in Figure 2-75.
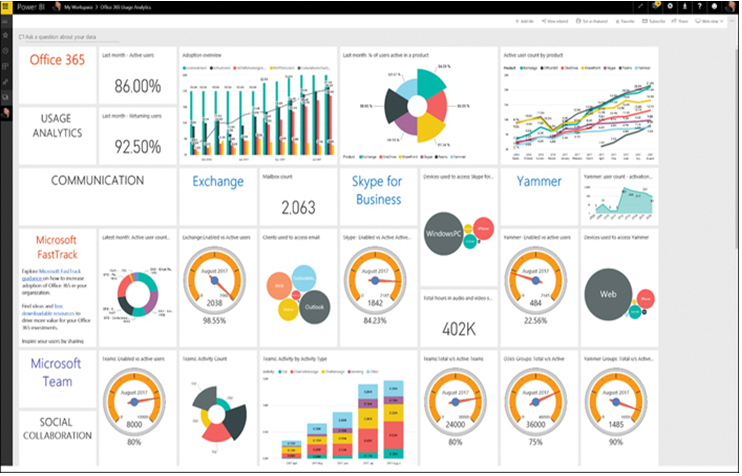
FIGURE 2-75 The Microsoft 365 Usage Analytics dashboard in Power BI
By clicking individual charts, administrators can see more detailed information about specific usage factors, including the following:
- Office activation Specifies the number and types of devices on which users have installed their five copies of Microsoft 365, as permitted by their license
- Adoption Specifies how many Microsoft 365 licenses have been assigned to users each month, how many are actually in use, and how many people are using Microsoft 365 for the first time
- Collaboration Indicates how often users collaborate by accessing other users΄ documents stored in SharePoint libraries or OneDrive
- Communication Specifies which Microsoft 365 tools workers prefer to use to communicate with each other in the enterprise, such as Exchange email, Microsoft Teams, or Viva Engage
- Product usage Tracks the usage of specific activities within each Microsoft 365 service
- Storage use Tracks per-user cloud storage for SharePoint sites, OneDrive, and Exchange mailboxes
- Access from anywhere Specifies which clients and devices workers are using to connect to email, Microsoft Teams, and Viva Engage
- Individual service usage Provides activity reports for individual Microsoft 365 services, including Exchange, SharePoint, and Microsoft Teams
Power BI is also customizable, enabling administrators to create their own reports and even add their own additional data sources.