
Microsoft Graph-Describe Microsoft 365 apps and services
Collaboration in Microsoft 365 can therefore be a matter of cloud-based services that provide content to each other, integrating the functions of multiple services into one interface. However, there is more to Microsoft 365 collaboration than simply placing Stream content next to SharePoint content in a Microsoft Teams window. Microsoft Graph is a developer API that enables Microsoft 365 applications to make intelligent suggestions about how users might take advantage of the available content.
For example, when editing a Word document stored on a SharePoint team site, a user can use @mentions to communicate with other team members. Pressing the @ key in a comment causes a list of team members to appear, as shown in Figure 2-33. After selecting a user from the list and typing a message, pressing the Send button generates an email containing the message to the selected user.
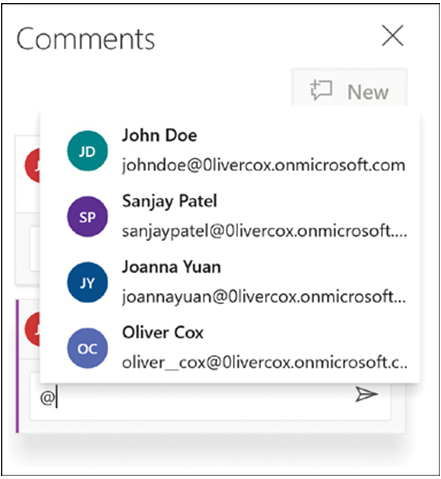
FIGURE 2-33 An @mention insertion list
Another function of the @mention capability is for users to insert notes to themselves by selecting To-do from the @ list. Graph interprets the note΄s contents and, if there are references to other documents in the SharePoint library, for example, displays an Insert From File pane containing suggested files.
Microsoft Graph can also evaluate the data in a document and suggest possible actions. For example, in an Excel spreadsheet that contains a list of countries, clicking the Geography button on the Data tab adds an information icon to each cell. Clicking the icon in one cell displays information about the country found on the Internet, as shown in Figure 2-34.
Selecting the list of countries and clicking the Insert Data button displays a list of statistical properties, as shown in Figure 2-35. Selecting one of the properties, such as Population, inserts the appropriate datum for each country in the adjacent cell.
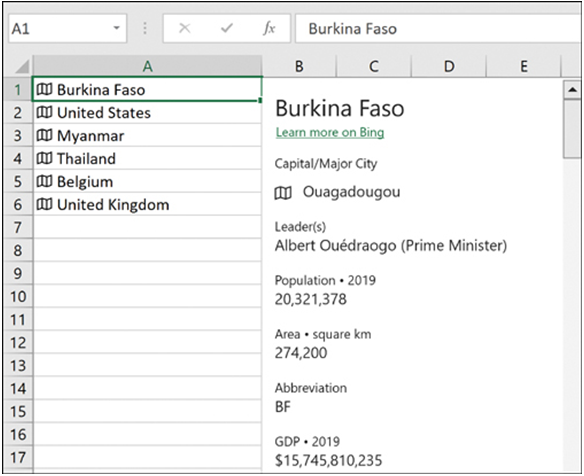
FIGURE 2-34 Internet country information displayed in Excel
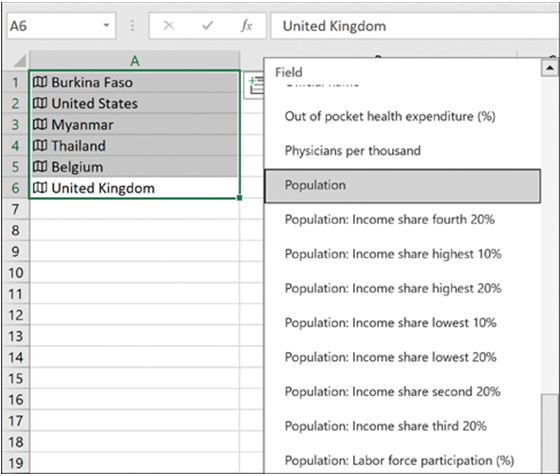
FIGURE 2-35 Insert Data options for selected countries in Excel
Selecting the newly added Population figures and clicking the Quick Analysis button displays the menu of options shown in Figure 2-36, which enables you to select formatting options and add chart types and totals to the spreadsheet.
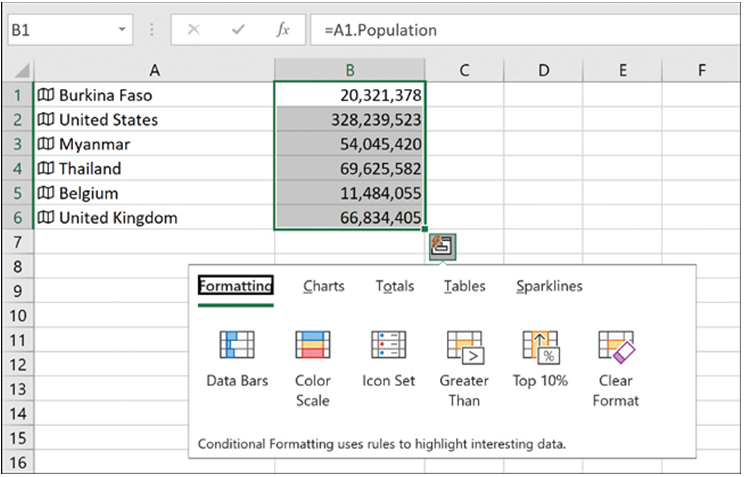
FIGURE 2-36 Quick Analysis options for Excel data
Microsoft 365 administrators and developers can also enhance collaboration processes by using Microsoft Flow to automate workflows that incorporate Graph functions and other services. For example, when users discover a malfunctioning device, they can send a photograph of it to a mailbox associated with a flow. The flow can use Graph to identify the device in the photograph, search for a replacement in an inventory, and generate a shipping order that has the part shipped out to the user that reported the problem. The same type of process can automate technical support services, generate sales leads based on users’ Internet presence, and perform any number of other tasks without user intervention.